Tracking your AI usage before the rate limit hits
Running multiple AI agents burns through rate limits fast. We built a usage dashboard so you can see exactly where you stand — and plan your work accordingly.
The problem
AI coding agents are powerful, but they come with limits. Claude has a 5-hour rolling window and a 7-day window. When you're running one agent, you can roughly guess how much capacity you have left. When you're running 5 agents across different repos, you have no idea — until you suddenly hit the wall and everything stops.
Getting rate-limited in the middle of a complex task is worse than not starting. The agent loses context, your momentum breaks, and you're left waiting for a reset timer that feels like it never ends. We needed visibility into usage before it became a problem.
The usage dashboard
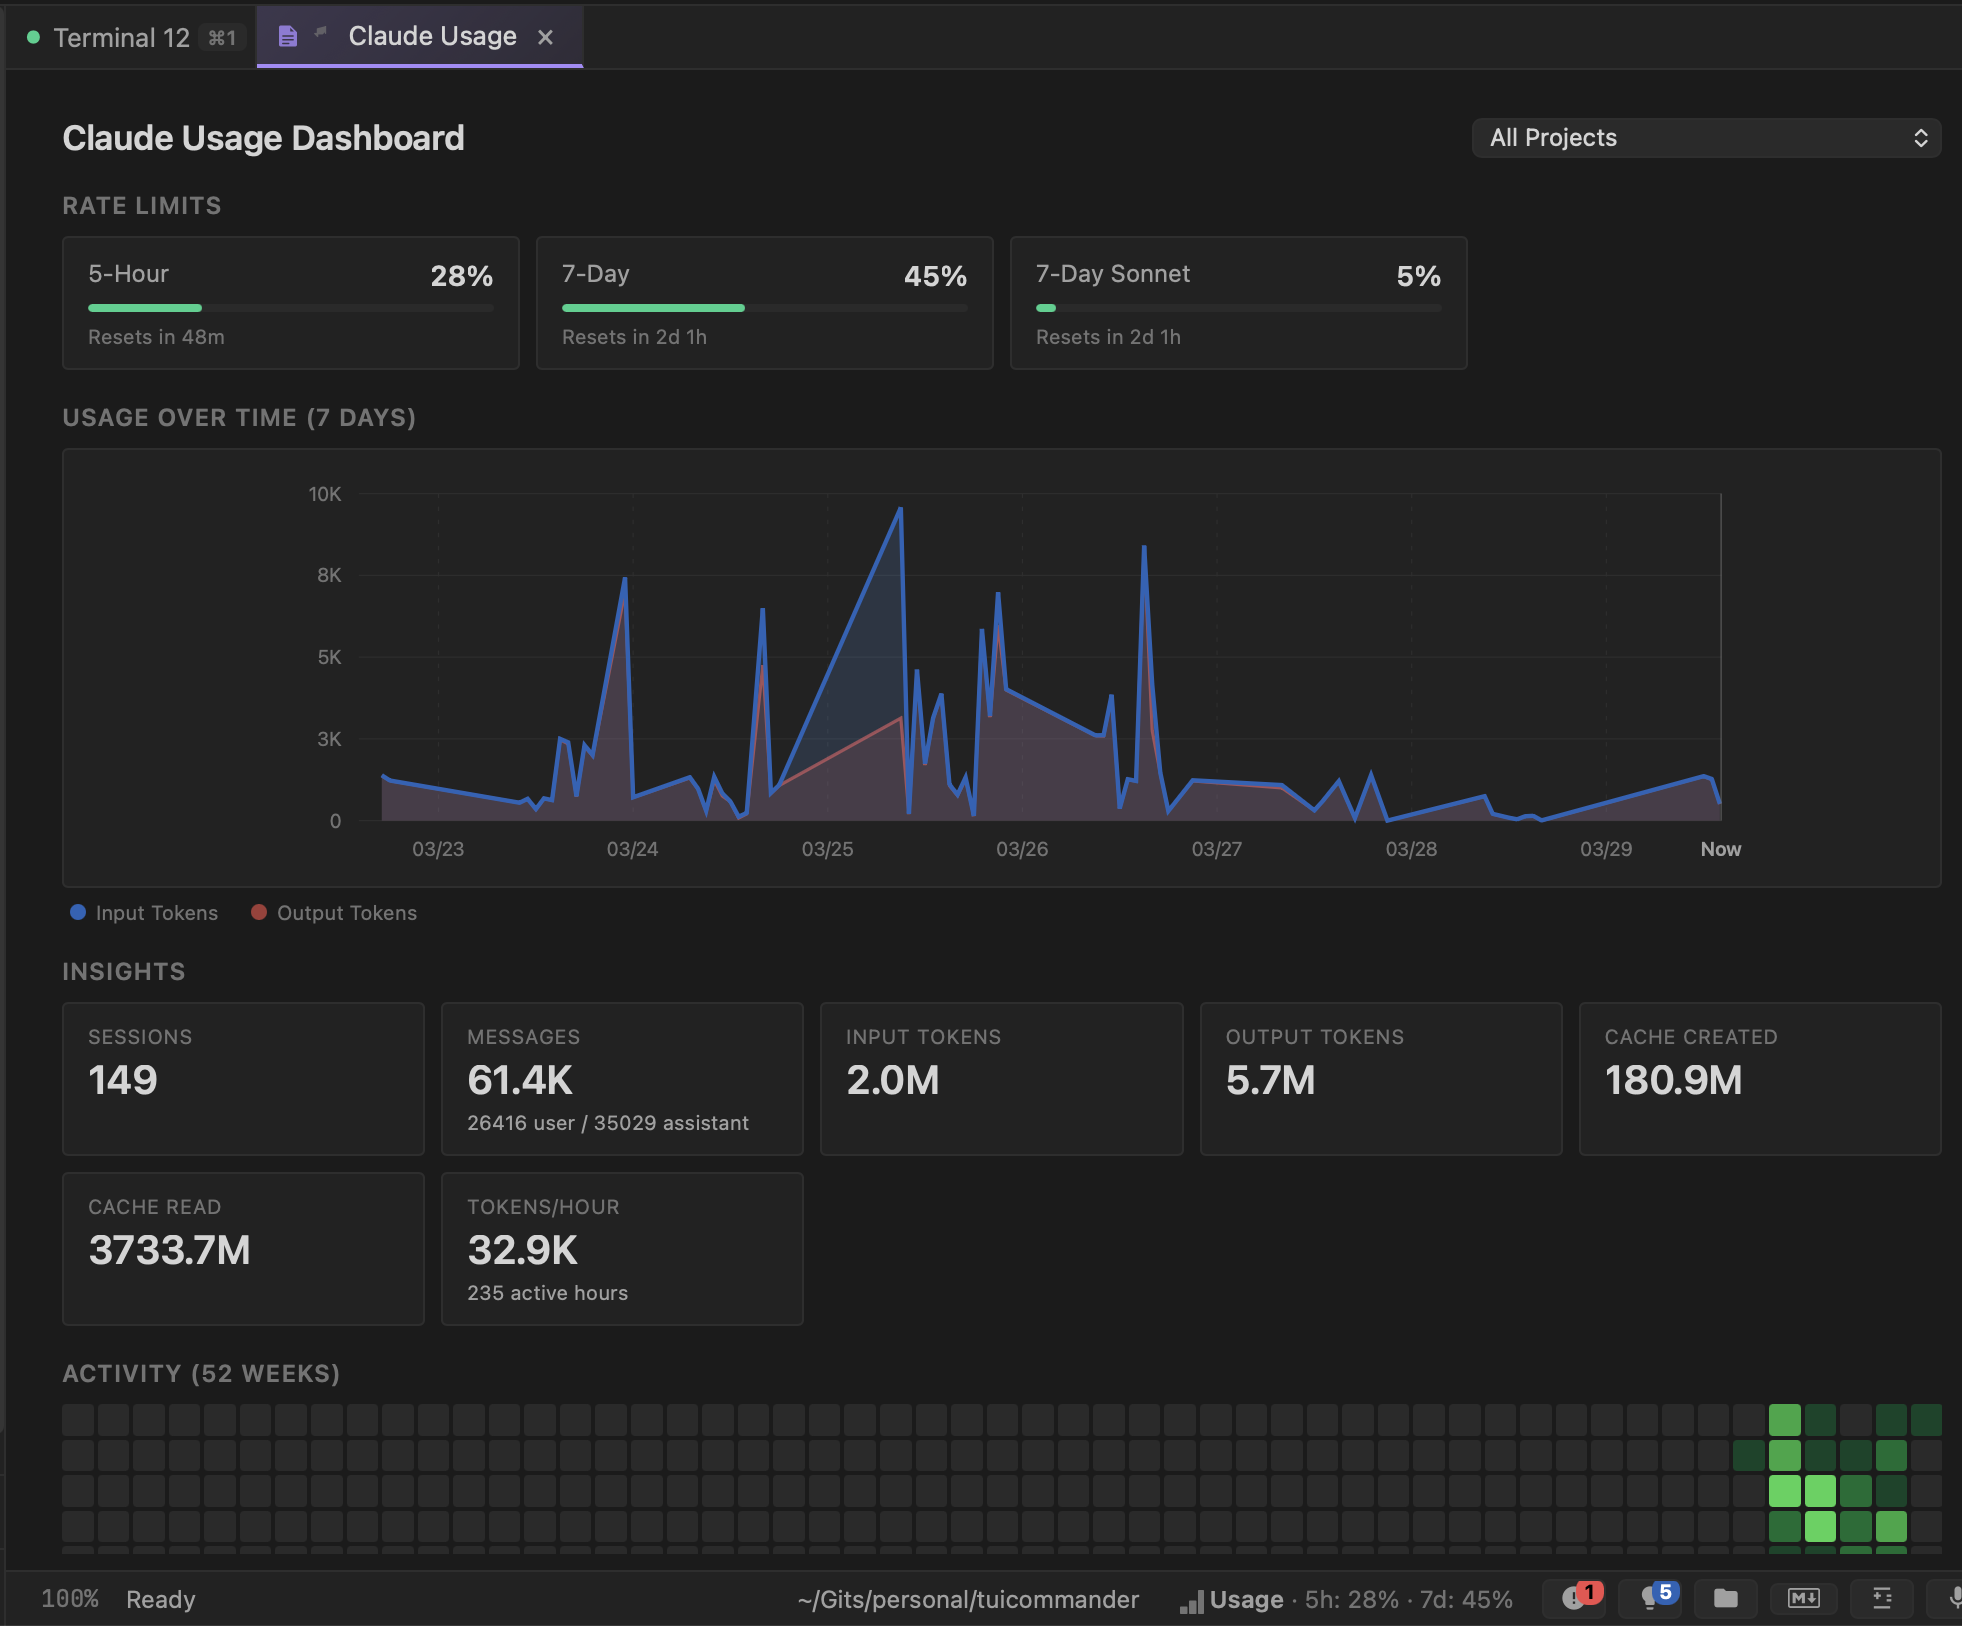
TUICommander parses rate limit information from agent output in real time and aggregates it into a dedicated Claude Usage Dashboard. At the top, you see your current position against each limit — 5-hour window, 7-day window, and per-model limits — with progress bars and reset timers. One glance tells you how much runway you have.
Below that, a 7-day usage chart shows your token consumption over time, split into input and output tokens. You can see your usage patterns: which days were heavy, when you hit peaks, and how the rolling windows are tracking. The project filter lets you break this down per repo if you want to see which project is burning the most capacity.
Insights that help you plan
The insights panel breaks down your usage into actionable numbers. Total sessions, messages (split by user vs assistant), input and output tokens, cache created and cache read, tokens per hour averaged across your active hours. These aren't vanity metrics — they help you understand your consumption pattern.
Cache metrics are particularly useful. A high cache read ratio means your agent is efficiently reusing context. Cache created vs cache read tells you whether your conversations are getting the benefit of prompt caching or constantly rebuilding context from scratch. This directly affects how fast you burn through your rate limits.
The status bar keeps you informed
You don't need to open the dashboard constantly. The status bar at the bottom of TUICommander shows a compact usage indicator: "5h: 28% · 7d: 45%". It's always visible, always current. When you're approaching a limit, you know it before launching another expensive agent task.
This changes how you schedule work. If you're at 80% on the 5-hour window, maybe you do the code review yourself instead of asking an agent. If you're at 10% on the 7-day window, you can confidently run multiple agents in parallel without worrying about hitting the ceiling.
52-week activity heatmap
At the bottom of the dashboard, a GitHub-style activity heatmap shows your usage intensity over the past year. Darker green squares mean heavier usage days. It's a quick visual answer to "am I using this tool more or less than I used to?" and a satisfying way to see the value you're getting from AI-assisted development over time.
What's next
We're working on usage-aware scheduling — letting TUICommander automatically balance agent workload across rate limit windows. If you queue up 3 tasks and the 5-hour window is nearly full, it could run the quick one now and defer the heavy ones until after the reset. Smart resource management for AI-first development.